Calculating differential pressure from flow rate is critical for battery water cooling plates and is a key parameter in early design. In the previous article, we explained how to calculate pressure drop. This article will focus on the measured drop pressure results.
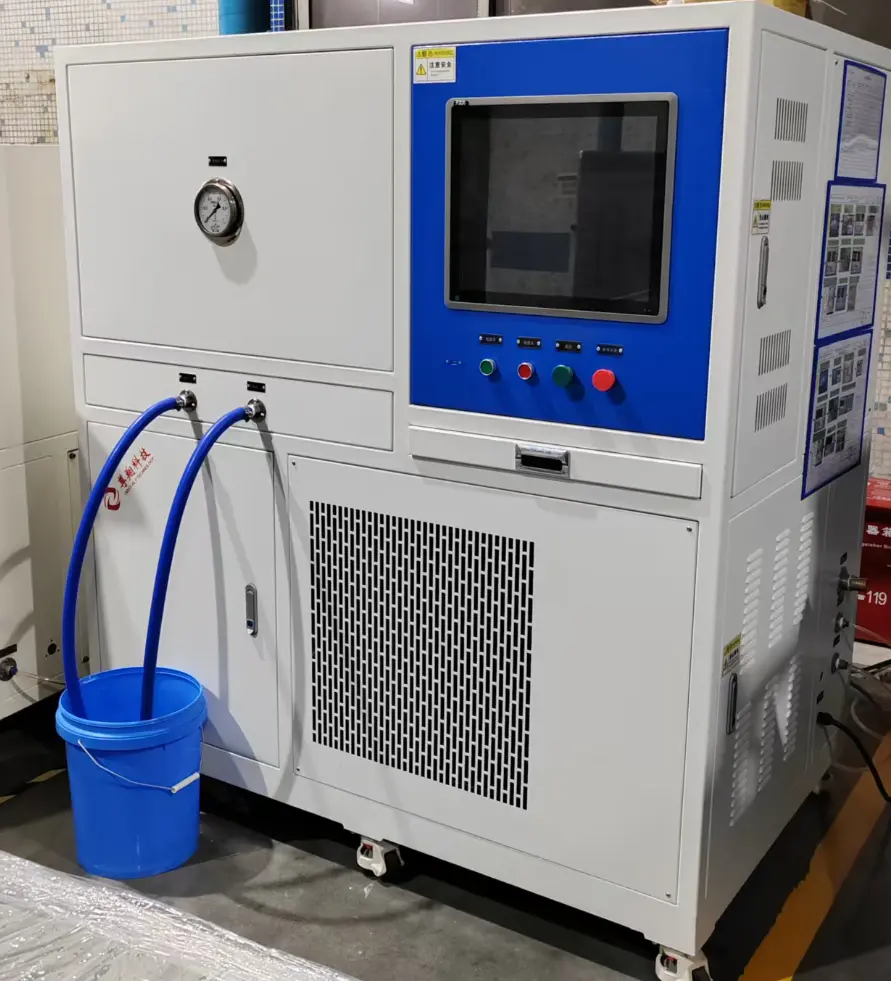
1.Pressure drop test bench
A pressure drop test bench for a battery liquid plate. Quick-connect connectors connect the inlet and outlet of the battery cooling plate. The test bench allows for setting flow rate and temperature.
2.Pressure drop test parameter set up
Following the previous blog post on calculating pressure drop, the coolant temperature on the test bench was set to 25°C and the flow rate to 10L/min.
Meanwhile, in order to calculate differential pressure from flow rate, I also test the 6,8,12,15 and 18L/min.
3.Pressure drop test result
| Nb.# | Pressure drop result(Kpa) | Flow rate(L/min) | Coolant Temperature(℃) |
| 1 | 6.33 | 6 | 25.2 |
| 2 | 9.91 | 8 | 25.2 |
| 3 | 13.95 | 10 | 25.2 |
| 4 | 18.55 | 12 | 25.2 |
| 5 | 27.28 | 15 | 25.2 |
| 6 | 37.28 | 18 | 25.2 |
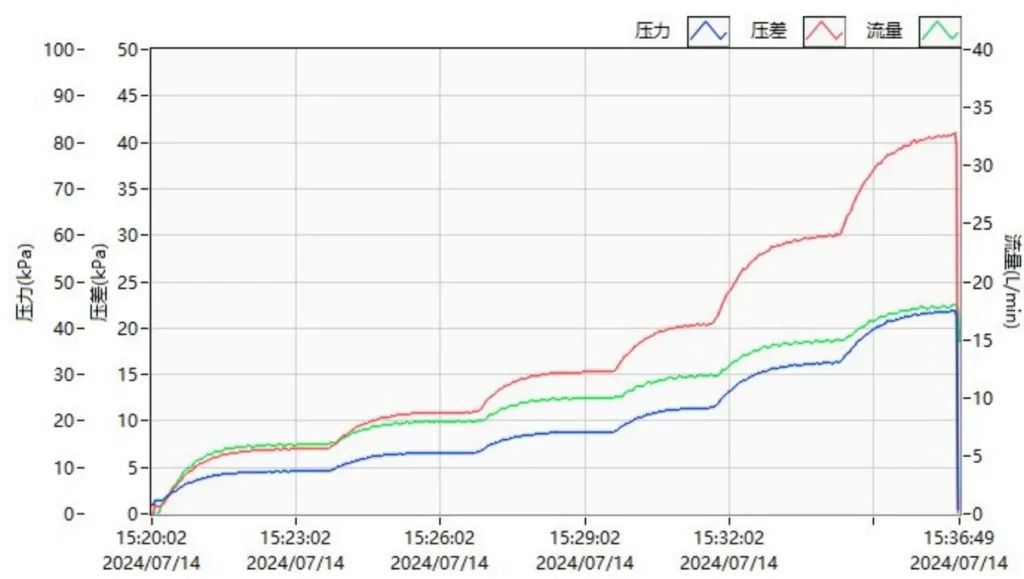
Below is the pressure drop test curve from bench.
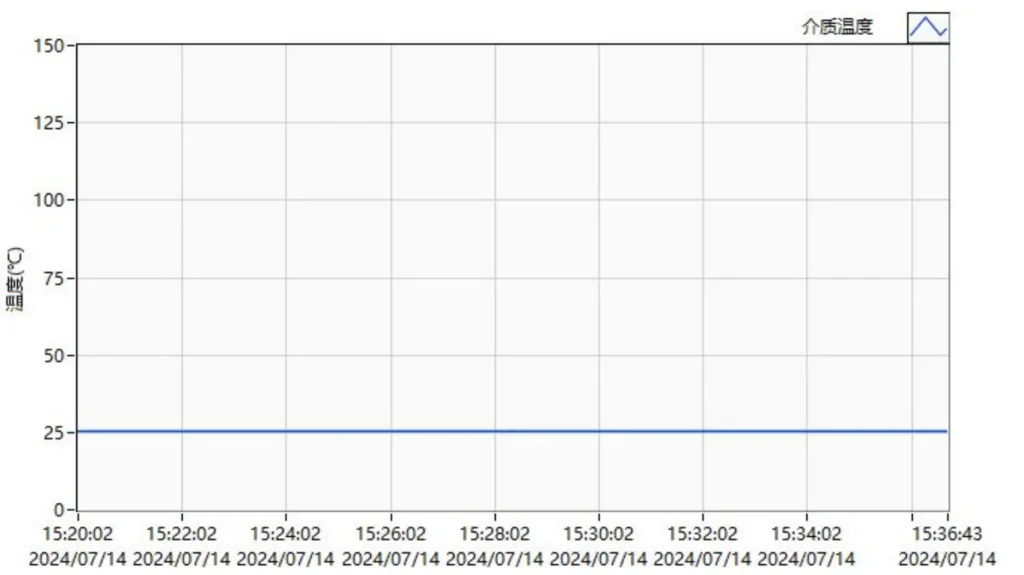
The temperature curve of the coolant monitored by the test bench is listed below, stabilized at around 25.2°C, which is basically consistent with the simulation.
4.Test result vs calculation result on pressure loss
Simulation result is 15Kpa@10L/min, while real test result on bench is 13.95Kpa, the error rate is 7.5%. That is enough for develop the batter cooling plate for EV and energy storage battery.